Diese Cookies sind erforderlich, um alle von Repetico bereitgestellten Funktionen auszuführen. Dies schließt einige Cookies von Google ein, da wir Google Sign In für unsere Anwendung anbieten und diese Google-Cookies erforderlich sind, damit dies ordnungsgemäß ausgeführt wird.
(Zeige mehr Details)
PHPSESSID: Sitzungsverwaltung
cookieconsent_dismissed: Alte Cookie-Richtlinie akzeptiert
somevalue: Sitzungsverwaltung
G_AUTHUSER_H (google.com): Mit Google anmelden
G_ENABLED_IDPS (google.com): Mit Google anmelden
NID (google.com): Mit Google anmelden
1P_JAR (google.com): Mit Google anmelden
CONSENT (google.com): Mit Google anmelden
darkmode: Dunkles Thema aktivieren oder deaktivieren
onSaveCreateNew: Nach dem Speichern weitere erstellen
showActivityBar: Aktivieren oder Ausblenden der Aktivitätsleiste
cardsetListLayout: Kompakte oder breite Liste von Kartensätzen
newCardLayout: Kompaktes, mittleres oder breites Kartenlayout beim Erstellen einer Karte
viewCardLayout: Kompaktes, mittleres oder breites Kartenlayout beim Browsen von Karten
learnCardLayout: Kompaktes, mittleres oder breites Kartenlayout beim Lernen
focusMyAnswerText: Stelle im Lernmodus den Fokus auf das Antwortfeld
show-lp-bar: Lernpunktleiste ein- oder ausblenden
tinymcePanelVisibility: Symbolleiste des tinyMce-Editors ein- oder ausblenden
cardSetLegendUnderstood: Erste Erklärung zu Kartensätzen ausgeblendet
repetico-app-banner-closed: Werbung für die App geschlossen
scoring-banner-2014-closed: Erklärungsbanner für Lernpunkte geschlossen
news-notice-closed: Schlagzeile geschlossen
numberOfNewCards: Anzahl der erstellten Karten
category_preselection_(cardset-id): Vorauswahl von Kategorien für neue Karten
hideAutomaticRecommendations: Werbung für käuflichen Kartensatz ausgeblendet
newCardQuestionType: Erstelle standardmäßig eine normale Karte oder Multiple Choice
mcOptionsCount-(cardset-id): Standardanzahl der Multiple-Choice-Antworten für neue Karten
cardsetCardsLayout-(cardset-id): Art der Kartenliste im Kartensatz
cookieSelection: Gespeichertes Ergebnis dieser Cookie-Auswahl
Statistiken (Details anzeigen)
Dies sind einige Cookies von uns selbst, mit denen wir anonyme Kauf- und Anmeldestatistiken verfolgen. Es gibt auch einige Cookies von Google, die für Google Analytics verwendet werden. Wenn Sie diese Cookies deaktivieren, deaktivieren Sie Google Analytics für diese Website.
(Zeige mehr Details)
referrer: Von welcher anderen Website kommen neue Benutzer
proPurchaseTrigger: Welches war das Banner oder die Anzeige, die Benutzer veranlasste, die PRO-Version zu kaufen
_gat_UA-29510209-2 (google.com): Google Analytics
_ga (google.com): Google Analytics
_gid (google.com): Google Analytics
Mit einem Klick auf „Alle akzeptieren“ hilftst Du uns bei der Weiterentwicklung unseres Geschäftsmodells.
Einloggen
Aktiviere "Mit Google anmelden"
Aktiviere "Mit Apple anmelden"
oder per Benutzername oder E-Mail-Adresse:
Kontakt
Ihr Name:
Ihre E-Mail-Adresse:
Ihre Anfrage:
Betriebspause zur Server-Wartung in:
Tage
h
m
s
Kategorien
Kategorien auswählen
Karte an Position verschieben
Aktuelle Position: 133
Zielposition:
Karten-Feedback
Schreibe direkt an den Autor der Karteikarte: Deine Anmerkungen, Ergänzungen und Korrekturen.
Eine Urheberrechtsverletzung melden
Wenn Du sicher bist, dass der Ersteller dieser Karte jemandes oder Dein Urheberrecht verletzt hat, teile uns dies bitte mit. Wenn Ihre Beschwerde gerechtfertigt ist, werden wir die Karte so bald wie möglich entfernen.
Wenn Du sicher bist, dass der Ersteller dieses Kartensatzes jemandes oder Dein Urheberrecht verletzt hat, teile uns dies bitte mit. Wenn Ihre Beschwerde gerechtfertigt ist, werden wir den Kartensatz so bald wie möglich entfernen.
Bitte gib mindestens einen Link zu einer Quelle an, mit der wir überprüfen können, ob Deine Beschwerde berechtigt ist!
Bitte gib uns Deine Kontaktinformationen (wie Telefonnummer oder E-Mail-Adresse), so dass wir Dich für Rücksprache kontaktieren können, falls nötig.
Verschieben
Verschiebe die Karte in einen anderen Kartensatz.
Zielkartensatz:
Position:
#
Erstelle Kategorien im Ziel-Kartensatz, falls noch nicht vorhanden
Kopieren
Kopiere die Karte in einen anderen Kartensatz.
Zielkartensatz:
Position:
#
Erstelle Kategorien im Ziel-Kartensatz, falls noch nicht vorhanden
Mehrere neue Karten
Anzahl neue Karten:
mit je Antwortmöglichkeiten
Karte als neu veröffentlichen oder aktualisieren
Du kannst die aktuelle Version der Karte auf ihre Kopien veröffentlichen, so dass die Besitzer die neueste Version erhalten.
Dies würde x Karten betreffen.
Die Veröffentlichung gibt den Besitzern der Kopien lediglich das Angebot, Deine aktuelle Version der Karte zu kopieren. Diese Funktion prüft nicht, ob diese Version der Karte tatsächlich Änderungen enthält.
Deine Anmerkungen zum Update:
Lernstufe
Setze eine neue Lernstufe für die Karte. Warnung: Hiermit kann man den Lernplan auf eine Weise ändern, die den Lernerfolg beeinträchtigen kann.
Lernstufe:
#
Kartensatz empfehlen
Empfiehl den Kartensatz weiter.
Einbetten
Nutze den folgenden HTML-Code, um den Kartensatz in andere Webseiten einzubinden. Die Dimensionen können beliebig angepasst werden.
Bei der Voreinstellung im Upload-Formular müsste eine Zeile in der CSV-Datei so aussehen:
"Frage","Antwort"
Falls das in Deiner Datei NICHT so ist, korrigiere bitte die Voreinstellung in den folgenden Feldern.
Drucken
Wähle das Format der einzelnen Karten auf dem Papier:
Test erstellen
Erstelle Vokabeltests oder Aufgabenblätter zum Ausdrucken.
Wähle ein Layout, das zum Inhalt der Karteikarten passt. Verwende das erstellte Dokument als Basis zur Weiterverarbeitung.
Layout:
Anzahl Karten
Lernzieldatum festlegen
Wenn dieses Datum festgelegt ist, werden (optional - in den Einstellungen aktivieren!) zu Beginn jeder Abfrage im Lernplan-Modus neue Karten hinzugefügt, um sicherzustellen, dass Du alle Karten rechtzeitig abgefragt hast.
Kartensatz:
Zurücksetzen
Kartensatz löschen
Willst du den ausgewählten Kartensatz wirklich löschen?
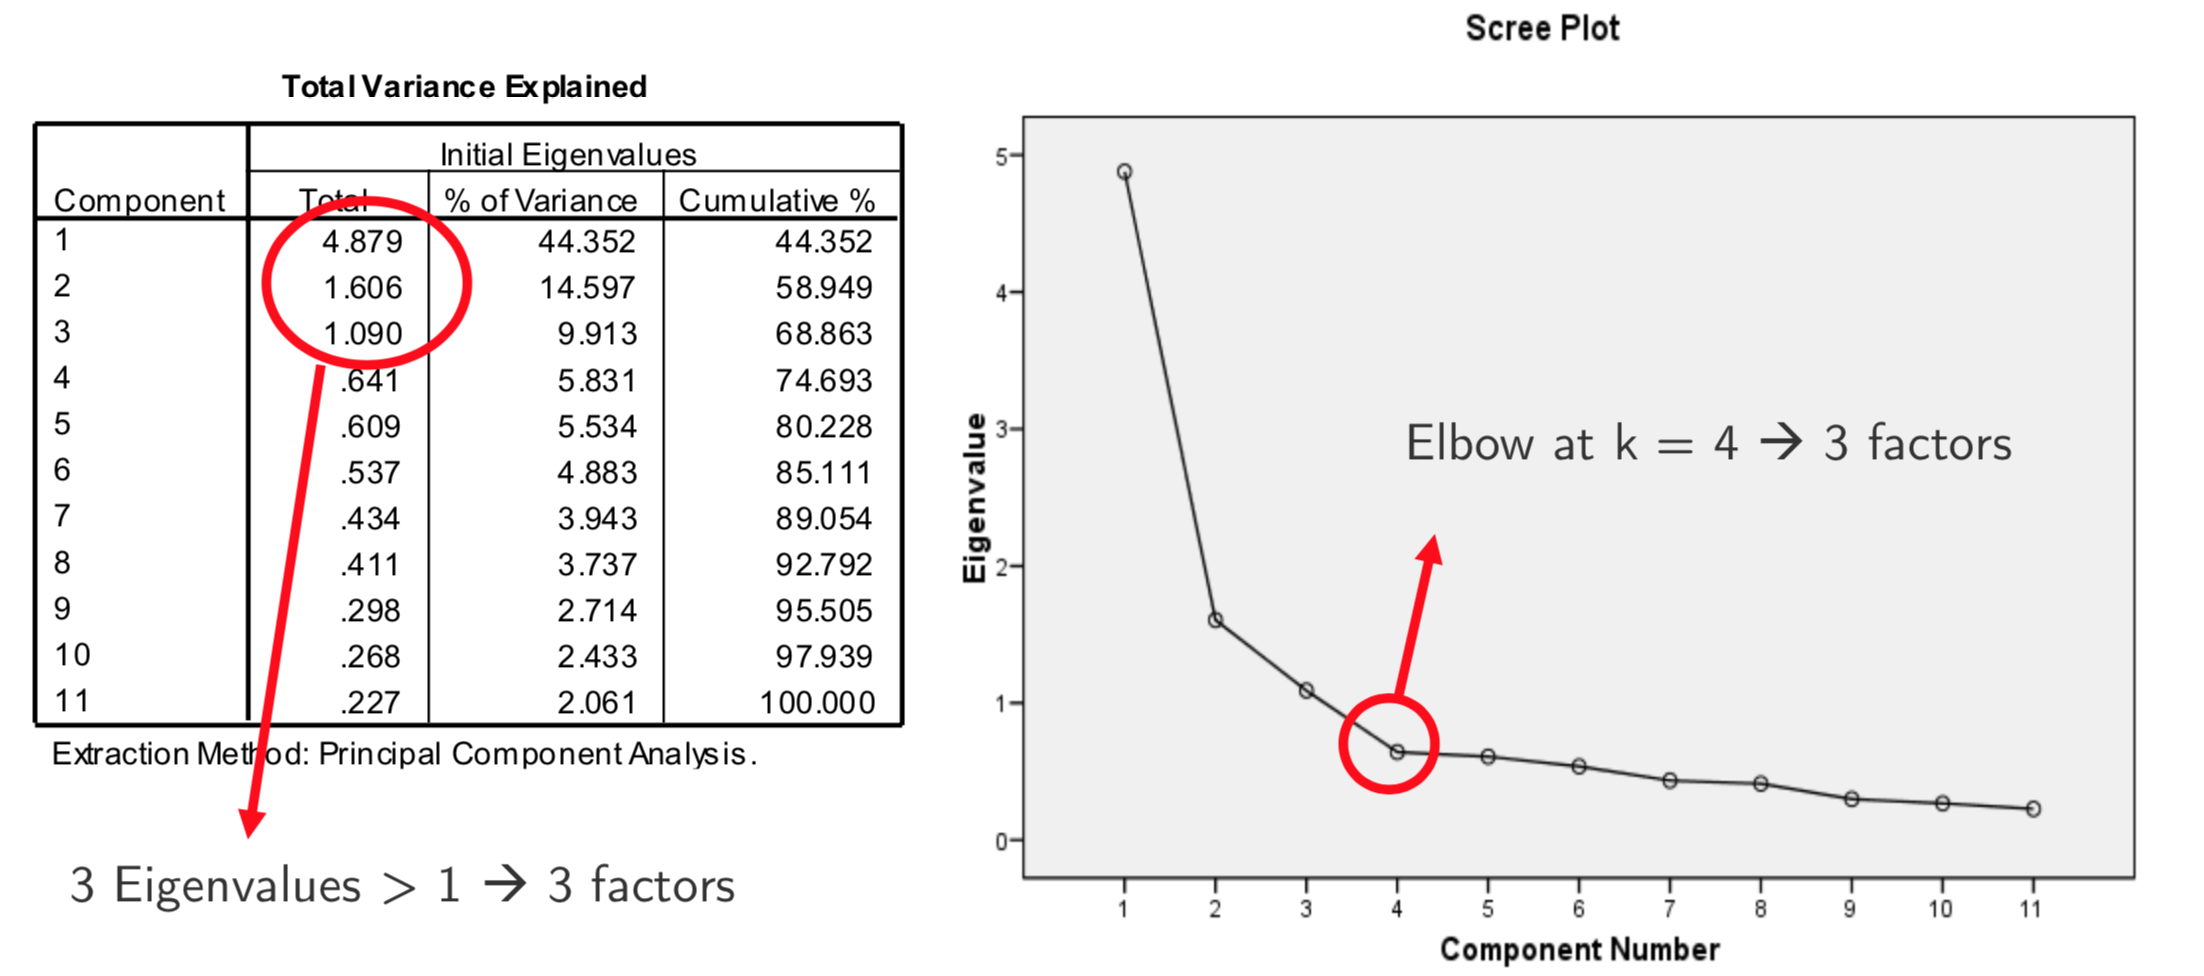
Visual exploration of a graphical representation of the eigenvalues.
In this method, the eigenvalues are presented in descending order and linked with a line.
Afterwards, the graph is examined to determine the point at which the last significant drop or break takes place—in other words, where the line levels off.
The scree plot is a graph that reports the percentage of variance explained by each factor
This is a third tool that can help in choosing the number of factors: it is recommendable to stop to the number of components that corresponds on the graph with a significant reduction of the slope of the line
In the example, the number of components to consider is 3 or 4
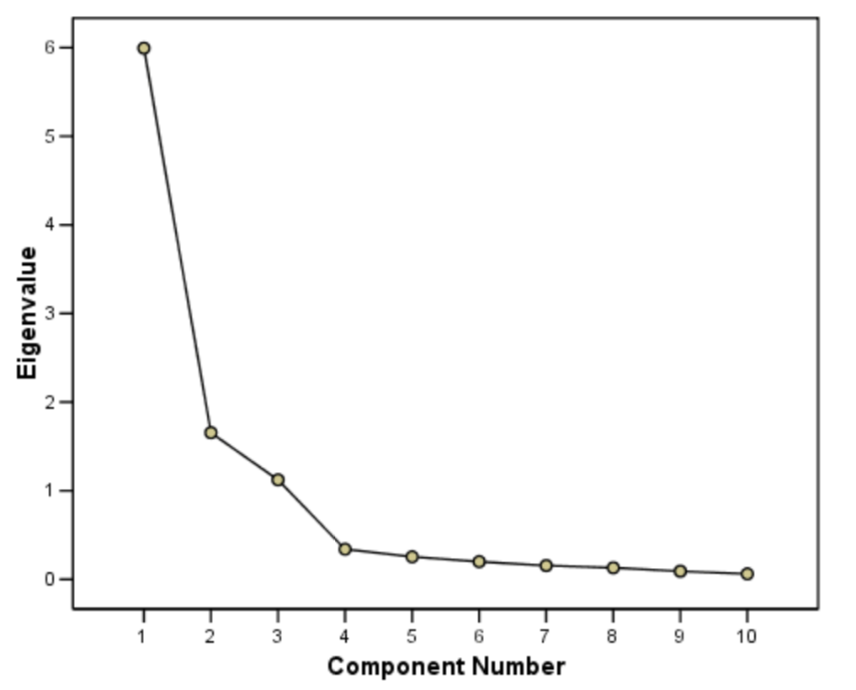
Visual exploration of a graphical representation of the eigenvalues. In this method, the eigenvalues are presented in descending order and linkedwith a line. Afterwards, the graph is examined to determine the point at which the lastsignificant drop or break takes place—in other words, where the line levels off. The scree plot is a graph that reports the percentage of variance explained by each factor This is a third tool that can help in choosing the number of factors: it is recommendable to stop to the number of components that corresponds on the graph with a significant reduction of the slope of the line In the example, the number of components to consider is 3 or 4
Stichworte
Mit Repetico PRO kannst du der Karte Stichworte zuordnen. Stichworte können verwendet werden, um Karten zu einem bestimmten Thema auch Kartensatz-übergreifend zu lernen.